Debugging in Neovim
Setting up a complete debugging workflow in Neovim from start to finish.
Neovim does not include built-in debugging support, but we can add it using plugins like nvim-dap, which integrates the Debug Adapter Protocol (DAP). DAP is a widely adopted protocol used by many popular debuggers like gdb, lldb, and Node.js.
require('lazy').setup({
  {
    'mfussenegger/nvim-dap',
  }
})
Once nvim-dap is installed, the next step is to install a debugger that supports DAP. Since I mainly work with Node.js, I'll set up debugging for Node.js, but the process is quite similar for other debuggers such as cppdbg for c++ or delve for golang.
Node.js has built-in support for debugging, but it uses the Chrome DevTools Protocol (CDP) instead of DAP. To bridge the gap between DAP and CDP, we need an additional layer. This is where vscode-js-debug comes in. It acts as a translator between the two protocols.
For installation, I'll use Mason along with Mason Tool Installer, as i already rely on them to manage my language servers.
mason_tool_installer.setup {
  ensure_installed = {
    "js-debug-adapter",
  },
}
And thats it, we have installed everything we need. The next step is to configure the debug adapter.
dap.adapters['pwa-node'] = {
  id = 'pwa-node',
  type = 'server',
  host = "localhost",
  port = 43229,
  executable = {
      command = "node",
      args = { "/root/.local/share/nvim/mason/packages/js-debug-adapter/js-debug/src/dapDebugServer.js", "43229" }
  },
  options = {
      detached = false
  }
}
The type property tells nvim-dap how to connect
to the debugger. If set to "server", it
connects over TCP using the specified host and port. If set to "executable", it runs the debugger as a local process. Setting detached = false
ensures that the debugger process is attached to Neovim and will stop
when Neovim exits. This debug adapter can now be used in the language
specific
launch configuration.
dap.configurations.javascript = {
  {
    name = "Launch file",
    type = "pwa-node",
    request = "launch",
    program = function()
      local currentFilePath = vim.fn.expand("%")

      return vim.fn.input('Path to executable: ', currentFilePath, 'file')
    end,
    cwd = '${workspaceFolder}',
  },
  {
    name = "Attach to process",
    type = "pwa-node",
    request = "attach",
    port = 9229,
    restart = true,
    cwd = vim.fn.getcwd(),
    sourceMaps = true,
    protocol = 'inspector',
  },
}
In the example above we have added two configurations. One to
actually start the application (Launch file)
and one that can attach to an already running node process (Attach to process). The name property can be chosen freely and
is used to identify the configuration in the UI. The type must match the type value defined in the corresponding adapter configuration.
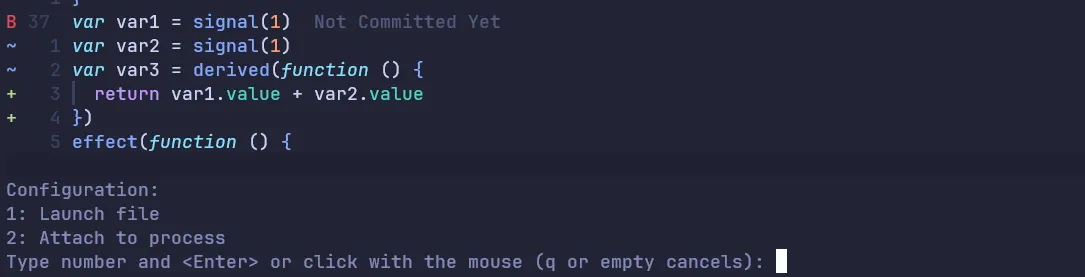
And thats it. Now we can open any javascript file and run :DabContinue. This will open a vim select where we can choose between the two
configurations.
The final step is to set up some convenient key mappings, so you don’t have to type out the commands every time. These are the mappings I use, feel free to copy or modify them to fit your workflow.
Tip
Personally, I’m not a fan of the default icons used by nvim-dap to indicate breakpoints and the current execution point. So, I use the following code to assign more visually appealing ones:
vim.fn.sign_define("DapBreakpoint", { ((text = 'B'), (texthl = 'DapBreakpoint'), (linehl = ''), (numhl = '')) })
vim.fn.sign_define("DapStopped", { ((text = '→'), (texthl = 'DapStopped'), (linehl = ''), (numhl = '')) })
vim.fn.sign_define("DapBreakpointRejected", { ((text = 'R'), (texthl = 'DapBreakpointRejected'), (linehl = ''), (numhl = '')) })
vim.cmd [[
  highlight DapBreakpoint guifg=#e74856 gui=bold
  highlight DapStopped guifg=#328aed gui=bold
  highlight DapBreakpointRejected guifg=#ff966c gui=bold
]]